

Google Analytics
Overview
Integrating Wingify Feature Management with GA4 offers powerful benefits. Wingify Feature Management sends feature flag and event data directly to GA4, allowing you to see which feature flag variations users encounter during their sessions. This enables you to correlate user behaviour and performance metrics with specific experiments and feature rollouts. As a result, you can better understand how new features impact key KPIs like retention, engagement, and conversion:
Prerequisites
Wingify FM SDK Installation and Configuration
- Ensure you have the Wingify Feature Management product enabled for your Wingify account.
- The Wingify FM SDK should be properly installed in your Node.js project.
- Set your Wingify account ID and SDK key in your application's constants in
.envfile:WINGIFY_ACCOUNT_ID=wingify_account_id WINGIFY_SDK_KEY=wingify_sdk_key
FLAG_KEY=flag_key FLAGVARIABLE_1_KEY=flag_variable1 FLAGVARIABLE_2_KEY=flag_variable2 EVENTNAME=event_name LOG_LEVEL= DEBUG # DEBUG, INFO, WARN, ERROR
### GA4 Account Setup

* Create a GA4 account at analytics.google.com if you don't already have one
* Create a new project in your GA4 dashboard
* Obtain your GA4 ***api\_secret*** and ***measurement\_id*** from the project settings,
* *api\_secret* can be ound under `Admin > Data Streams > Choose your stream > Measurement Protocol > Create` .
* *Measurement\_id* can be found under `Admin > Data Streams > Choose your stream > Measurement ID`.
* Configure ***api\_secret*** and ***measurement\_id*** in the following curl.
```curl
curl --location 'https://www.google-analytics.com/mp/collect?api_secret=apiSecret&measurement_id=measurementId' \
--header 'Content-Type: application/json' \
--data '{
    "client_id": "REPLACE_WITH_ACTUAL_CLIENT_ID",
    "events": [
        {
            "name": "jsonEvent",
            "params": {
                "campaign_id": "properties.campaignId",
                "variation_id": "properties.variationId",
                "campaign_name": "properties.campaignName",
                "variation_name": "properties.variationName"
            }
        }
    ]
}'
Refer to this google doc to get more information.
Required Dependencies
Add the following dependencies to your app:
# via npm
npm install wingify-fme-node-sdk --save

# via yarn
yarn add wingify-fme-node-sdk
Integration Steps
Integrating the Wingify FM SDK with analytics platforms like GA4 allows you to automatically send feature flag evaluation and event tracking data to your analytics dashboard. This is achieved using the IntegrationCallback provided by the FM SDK.
- Clone the Wingify FM Examples from GitHub
git clone https://github.com/wingify/vwo-fme-examples.git - Change directory to
nodecd vwo-fme-examples/node - Open the project in an IDE and open the file
vwoHelper.ts. It's located insidesrc > utils - Inside the
vwoHelper.tsfile, you will find theinitWingifyClientmethod. Within this method, there is a constant namedsdkConfig. Within sdkConfig, there is an integration object that requires the GA4 API to be invoked through the integration callback to send events to GA4.
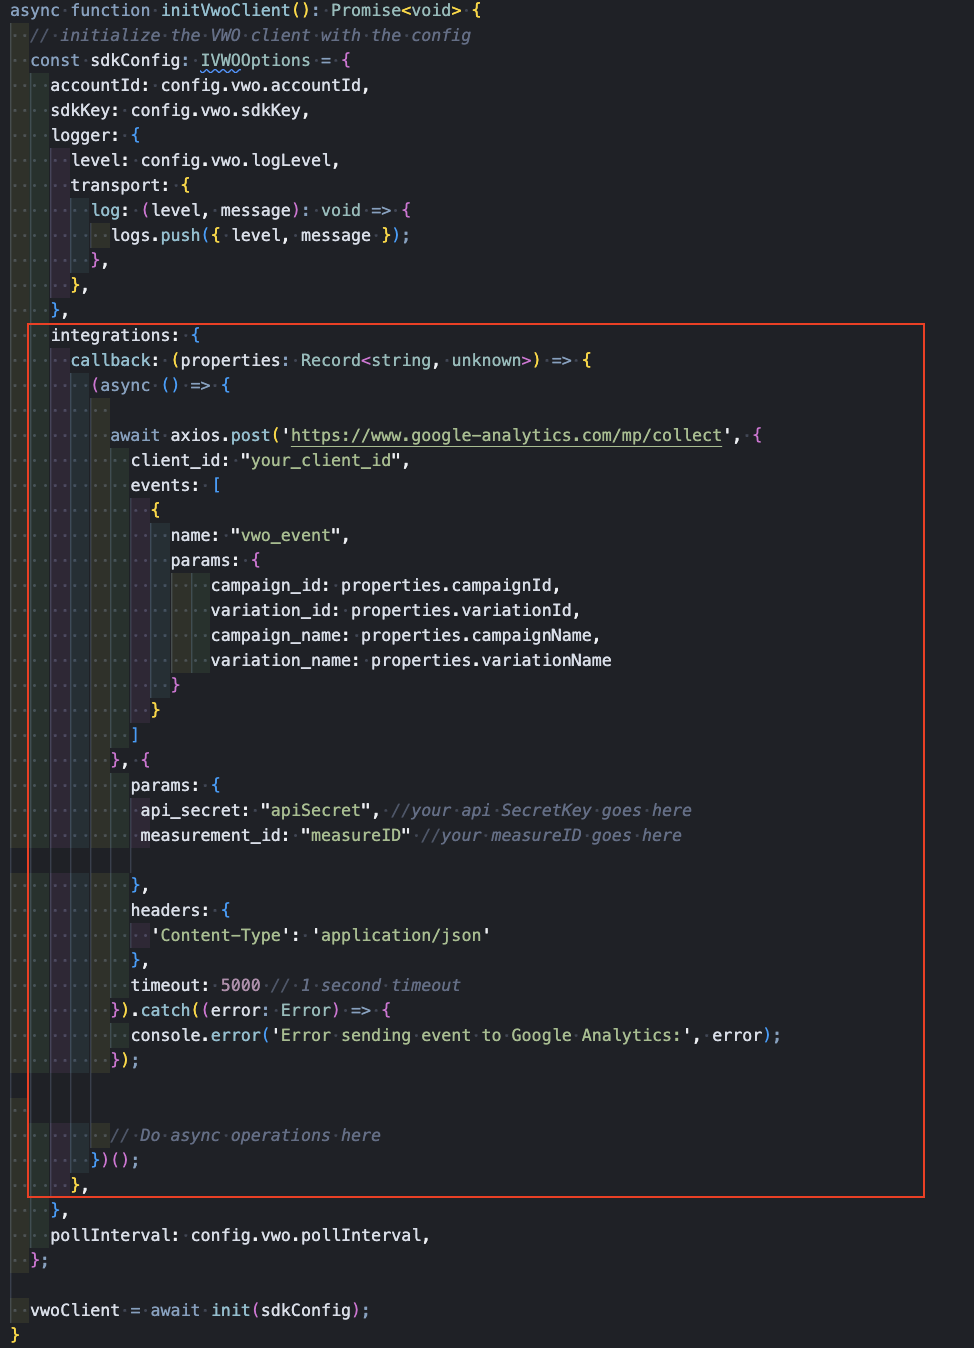
Integration Data
The IntegrationCallback receives a properties: Record<string, unknown> containing details about the Wingify SDK action:
- For flag evaluations (i.e.
getFlag):{ featureName: "flag_name", featureId: 5, featureKey: "flag_key", userId: "user_id", ... } - For event tracking (
trackEvent):{ eventName: "yourEventName", api: "track" }
How to see the data in the analytics tool
To see real-time events flowing into your Google Analytics 4 (GA4) property, follow these steps:
-
Log in to Google Analytics:
Go to the Google Analytics website and log in with your Google account that has access to the GA4 property. -
Select Your GA4 Property:
Once logged in, ensure you have selected the correct GA4 property from the dropdown menu at the top left of the interface (usually next to the Analytics logo). It will typically show the property name and ID. -
Navigate to Realtime Report:
- In the left-hand navigation menu, look for the
Reportssection. - Under
Reports, click onRealtime.
- In the left-hand navigation menu, look for the
-
Observe Realtime Data:
To view real-time data in Google Analytics 4 (GA4), scroll to the bottom of the left-hand menu, click Reports, then select Realtime Overview. This gives you a live snapshot of user activity on your website or app.Key Highlights:
- Active Users in the last 30 minutes and 5 minutes
- User Locations displayed on a world map
- Top Pages & Screens currently being viewed
- Live Events like page views, form starts, and impressions
- Audience Segments such as returning users or cart abandoners
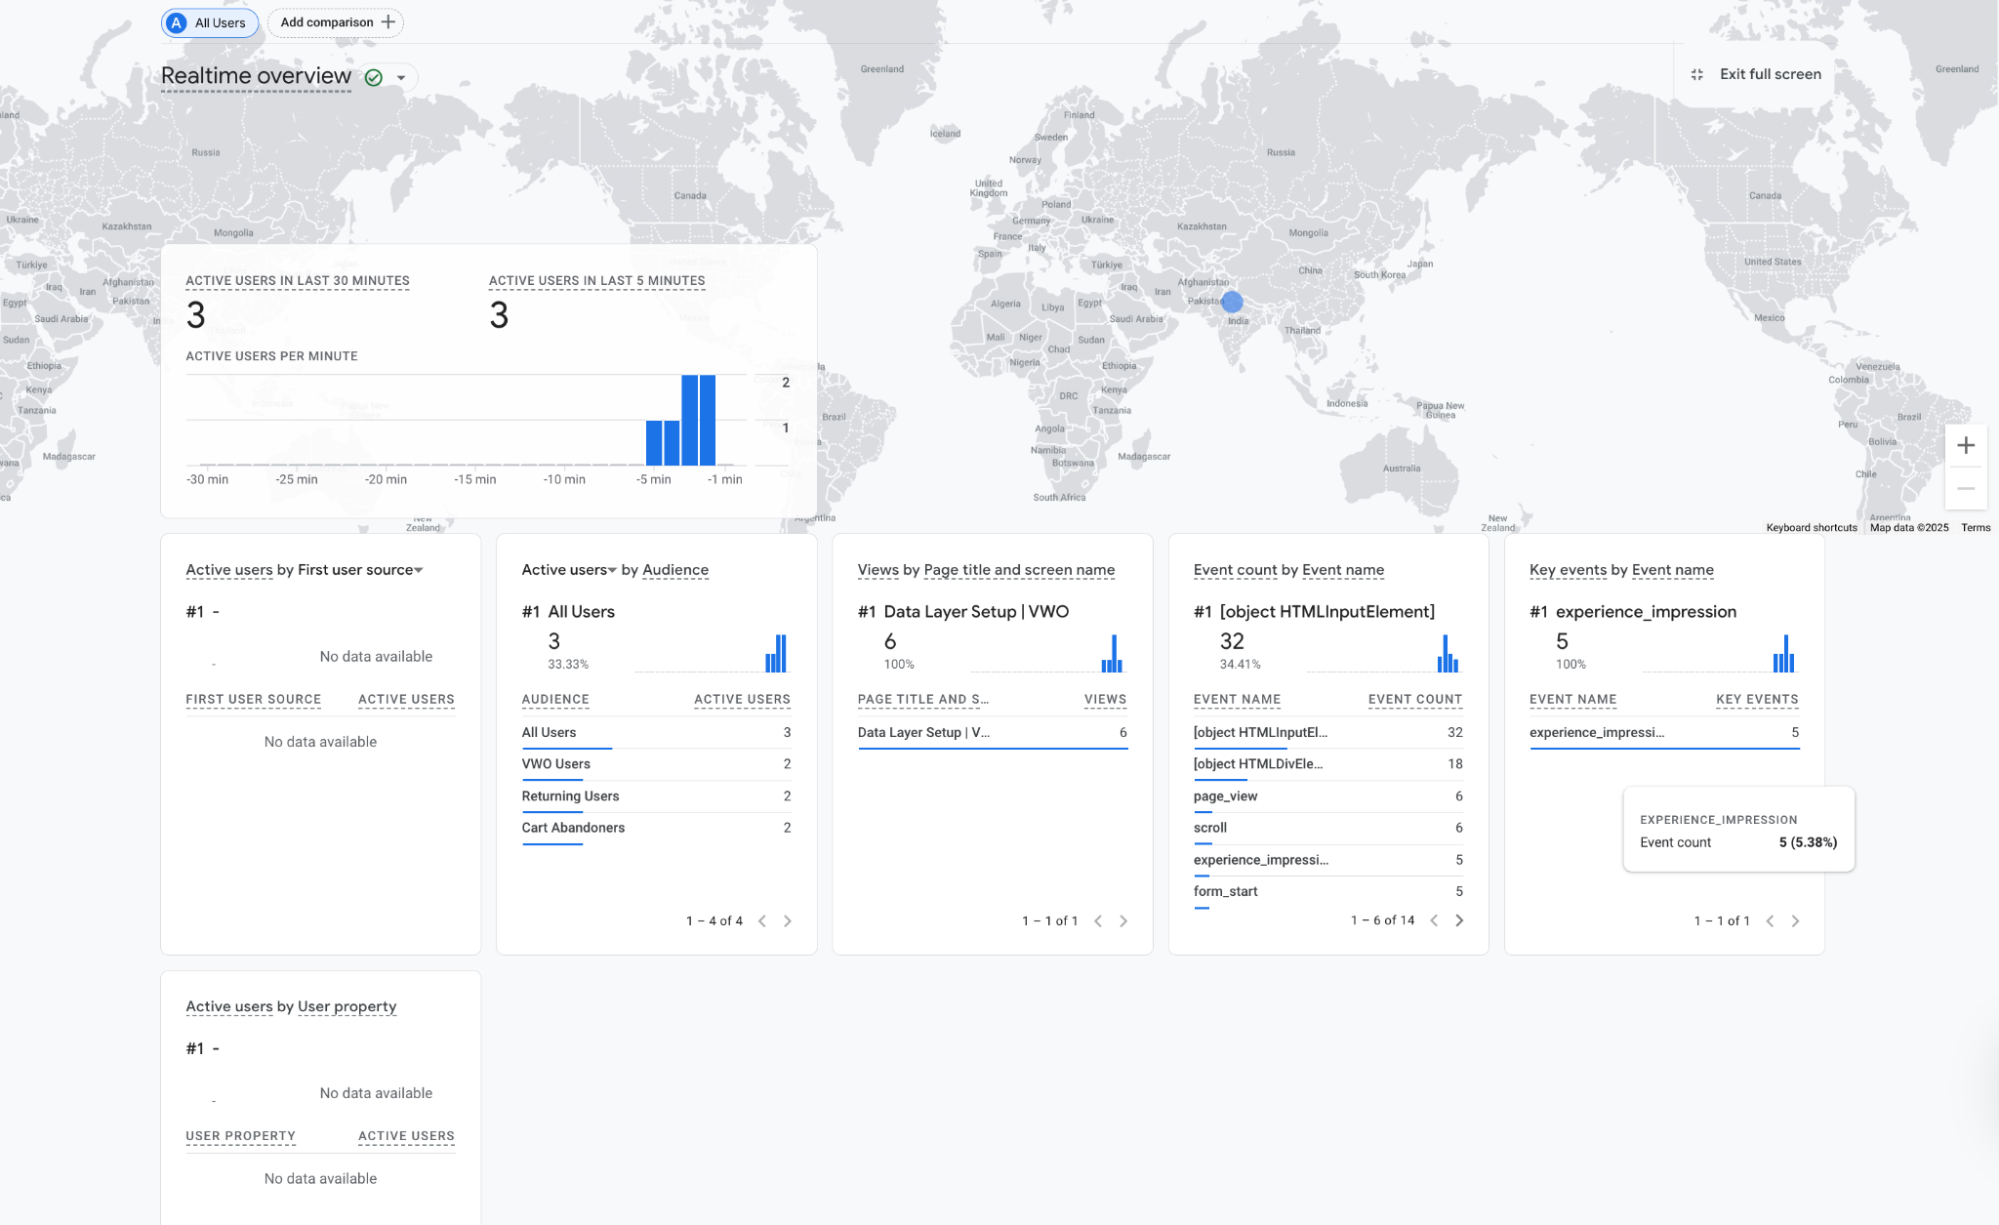
GA Reports
Updated 7 days ago